Cost of capital in the 21st century
Takeaway
The reduced cost of capital now implies a wealth transfer from savers to borrowers, and that it’s optimal for a person to be taking more risk today than before.
Implications of low cost of capital
I want to take a look at cost of capital today. I’ve been wondering what the implications are of our current low cost environment, plus Michael Pettis recently wrote a good article on interest rates vs growth, so let’s look closer at this topic. I won’t have all the answers either, so comments are definitely welcome, either reply directly or on the post’s comment box.
For those who don’t know what cost of capital is, not to worry. I’ll provide a brief explanation of the concept, before making the following points:
- Cost of capital is lower now than historically
- As a result, there is a wealth transfer from savers to borrowers
- This also implies that more risk taking should occur
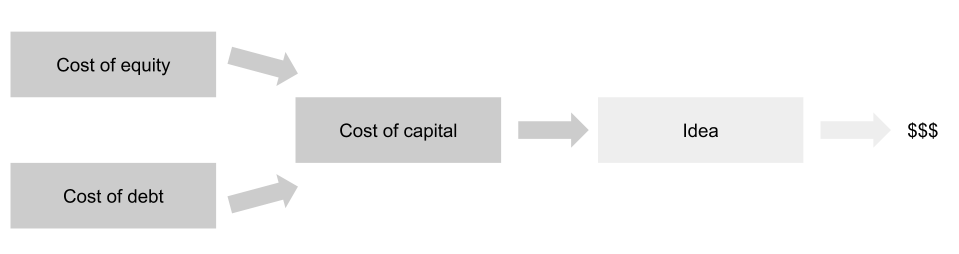
Cost of capital is the blended cost of financing your idea
Imagine you had an idea. It could be a new business idea, an expansion plan, or even some investment you were thinking of. All that matters is it requires money (capital), and hopefully returns you more money than you put in.

How do you get this money? There are two main sources of capital: debt and equity [1].
When you get cash in exchange for debt, you agree to pay back some amounts of the debt over time. We can calculate a cost of that, based on whatever the final percentage rate of return is. For example, if you paid $10 on $100, that’s a 10% cost [2].
When you get cash in exchange for equity, you don’t have to pay cash back, but you give up ownership. The amount that you give up depends on the expected return that investors have. We can calculate an implied cost of that. For example, if an investor put in money expecting a 20% return, that’s a 20% cost [3].
The blended costs of both of these main sources of capital combine to give you your cost of capital. This is the average cost that you will incur by trying the idea. For example, if your cost of capital is 5%, you’re “losing” 5% every year.
It also follows that you want to make more than your cost of capital. If you’re losing 5% a year, you need to make more than 5% in order to get a positive return. If your business returns 1% a year while costing 5%, you lose money over time.
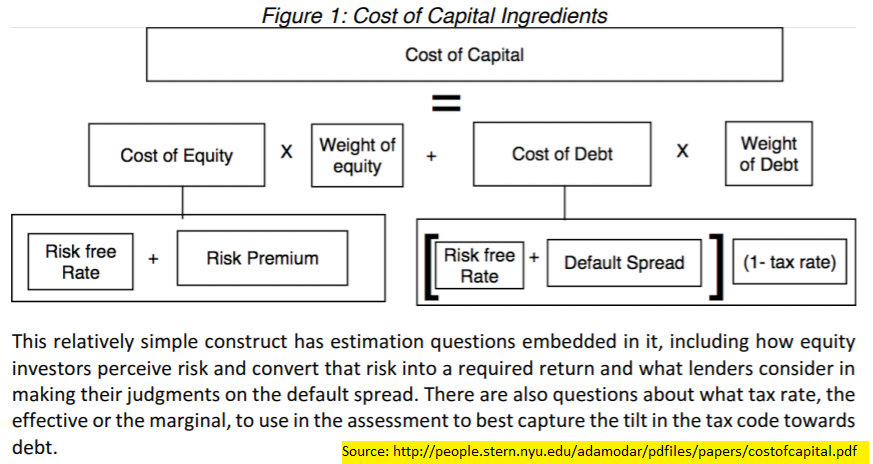
That was a simplified explanation, but it should give enough intuition for the rest of the article. If you’re interested in reading more, the king of valuation, NYU Prof Damodaran, has a paper explaining this in detail, which includes graphics like the below that rigourously extend the framework we discussed above.
Put another way: We want to make money. We need money. That money comes at a cost, which is the cost of capital.
1. Cost of capital is lower now
First, let’s establish the case that it’s less costly to get money now than before. To do so, we’ll look at a few graphs over time of rates.
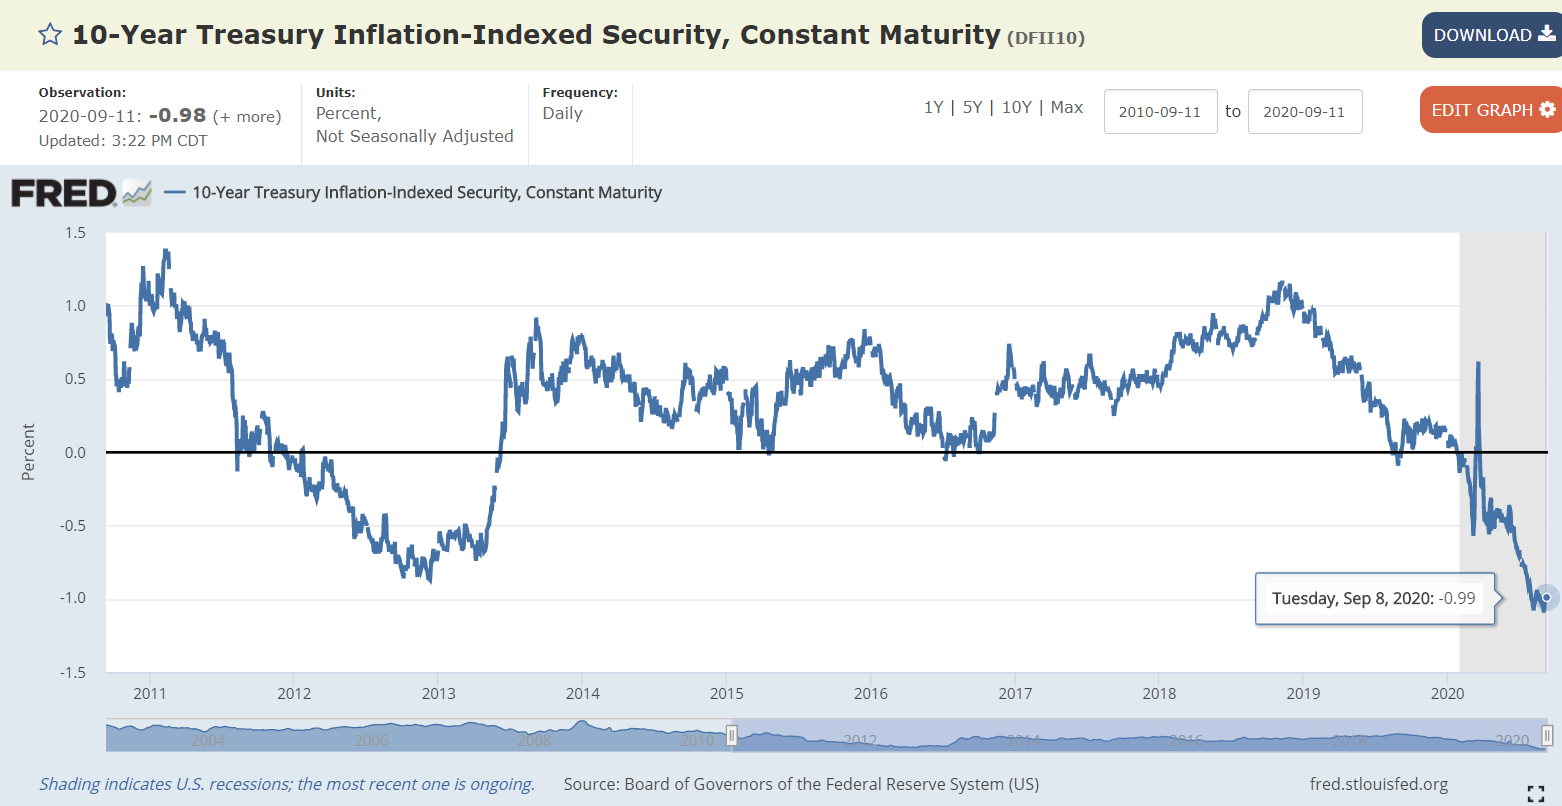
This is the past 10 years of the 10 year TIPS yield, pulled from the Fed [4]. For those unfamiliar with TIPS, they’re an inflation linked, “safe” type of debt. As we can see, yields are currently negative, having trended down over time.
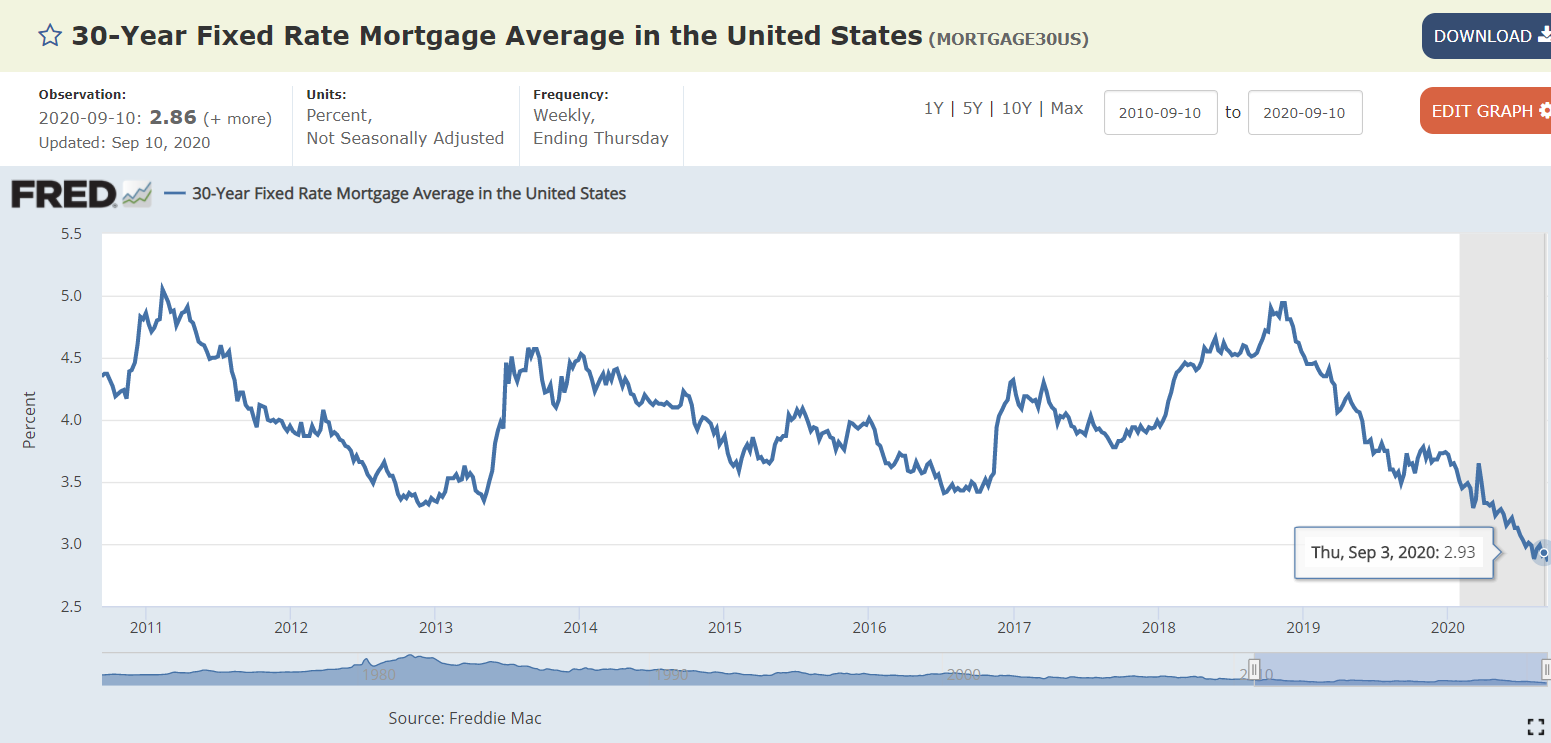
This is the past 10 years of the 30 year fixed rate mortgage cost, also pulled from the Fed [5]. We can see the cost of borrowing for a house has fallen as well.
And if you think I’m cherry picking by only looking at 10 years, let’s zoom out to the past 54 years, and look at the 10 year treasury rate. You can see the spike in rates before Volcker killed inflation, and the continued downtrend since.
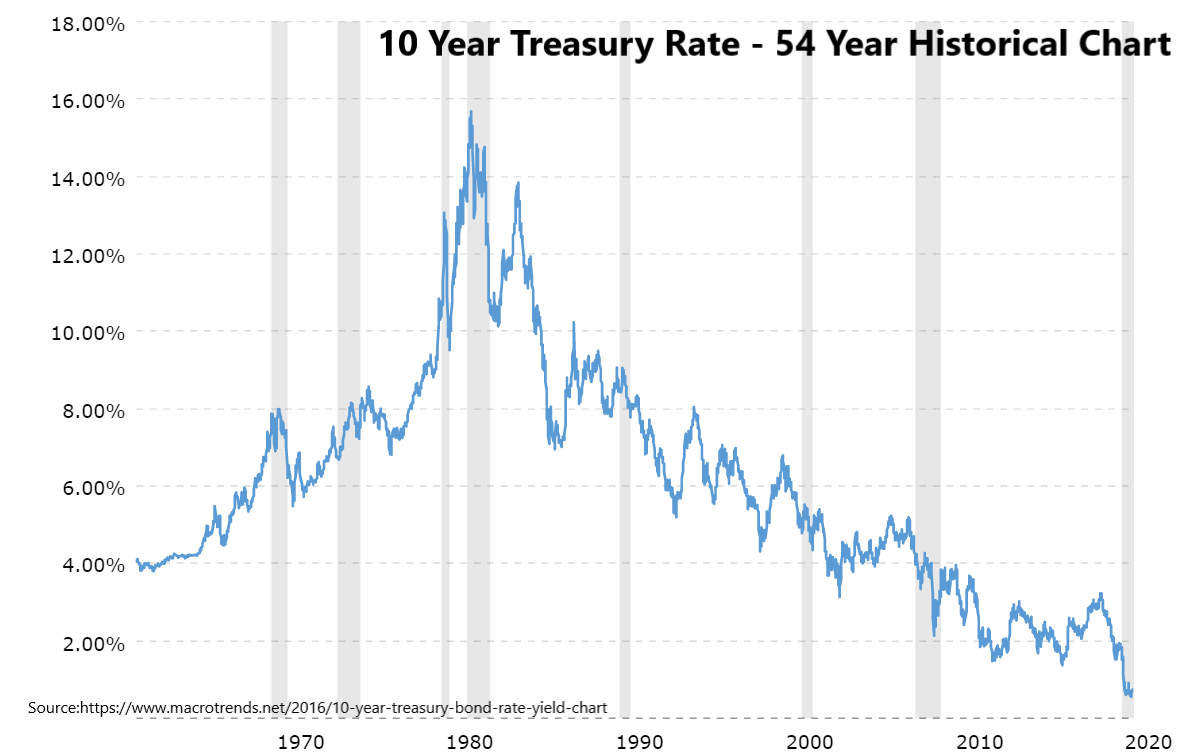
At this point I think we’ve shown the cost of debt has declined. What about the cost of equity?
I had more trouble finding average cost of equity, but we know that the cost of equity is related to the cost of debt, plus some additional return for the risk associated with equity [6]. We’ve shown the cost of debt has declined, so if we can find the trend in the additional return (the equity risk premium), we’ll understand the trend better.
Damodaran has a table in pg 142 of this report showing a slight increase in risk premium over time. For a more visual version, KPMG has the numbers below. They don’t tie out exactly, but are relatively consistent.
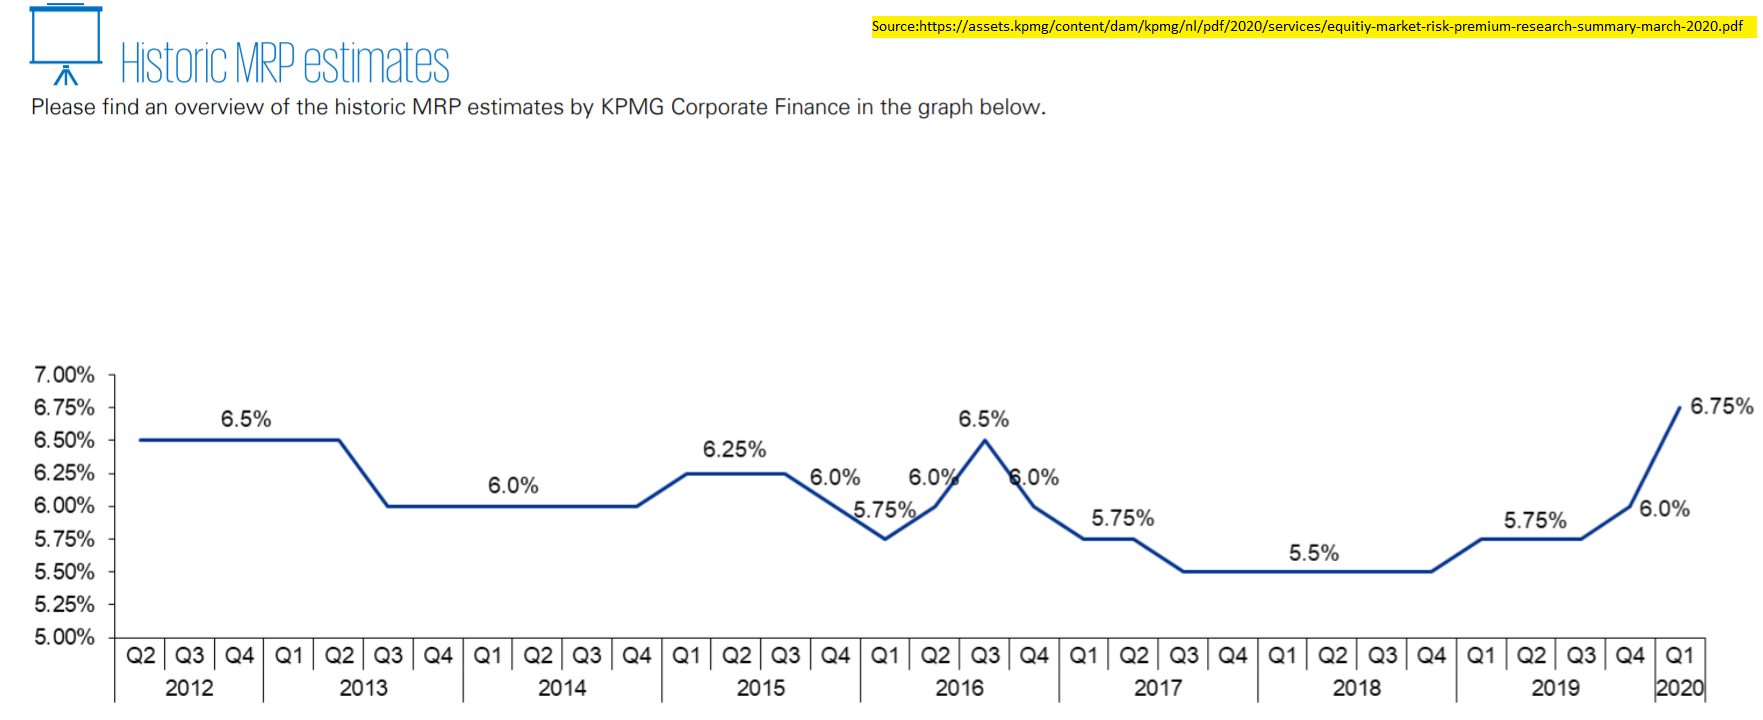
There’s a slight increase in recent months, but overall equity risk premiums haven’t risen as much as the cost of debt has declined. That implies that on net, the cost of equity has either been flat, or declined.
From the above, we’ve shown that the cost of capital has declined. This implies that raising money now, either via debt or equity, is cheaper than before.
2. Lowered cost of capital implies wealth transfers from savers to borrowers
Let’s introduce a complication. Above we said that a business should aim to grow more than their costs. People have extended this concept to countries, claiming that debt is sustainable when the growth rate of GDP (return) is more than the interest rate (cost of capital). To do so, they often cite famous economist Thomas Piketty’s work, Capital in the Twenty-First Century.
Michael Pettis argues here that extending the framework to countries doesn’t make sense. Instead:
At the macroeconomic level, the relationship between interest rates and GDP reveals much more about income transfers and the distribution of income within an economy than it does about the overall sustainability of that economy’s debt. In this respect, conditions operate quite differently for countries than for individuals or businesses
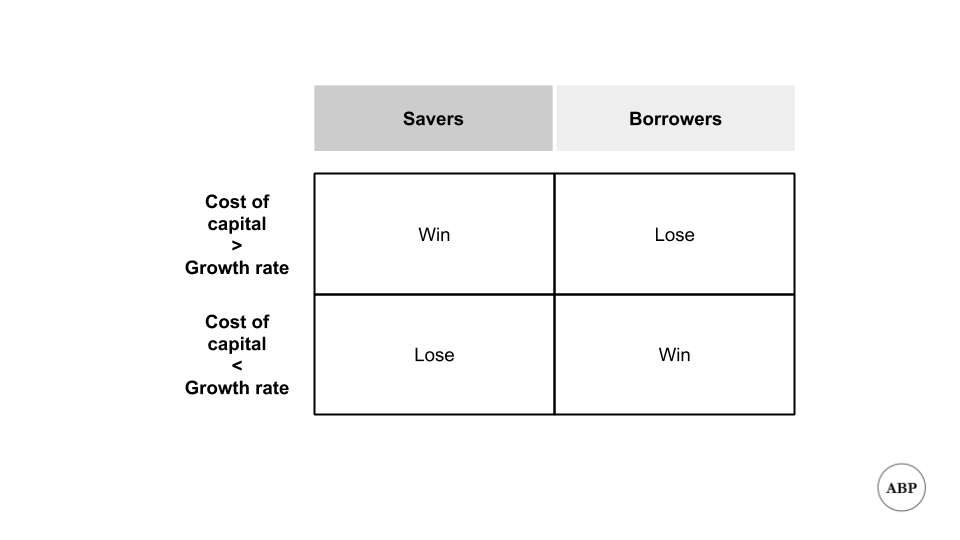
Let’s break down what he means, since this isn’t immediately obvious. Pettis is saying that an implication of costs being lower than growth is that the economy moves money away from people who are providing capital, towards those that are borrowing it.
If you had money and were lending it out, you’re lending it out at the market cost. If you invested it in the broad economy, you’re getting market growth. If that cost is lower than the average growth (rate of return), you’ve gotten a lower yielding asset compared to the higher yielding one before. Vice versa if the cost is higher than the growth rate.
This has differing implications on future growth as well as wealth inequality. The wealthy save more, so lowered costs result in a wealth transfer from the rich to the poor. This is offset by increased speculation on assets, which shifts wealth the other way. The net effect of this depends on relative size of each. Pettis doesn’t make this point, but I believe that the speculation piece has more than offset the former effect, and that’s a cause of rising wealth inequality.
3. Lowered cost of capital implies more risk taking should occur
This is where I get more speculative. A lowered cost of capital vs growth also implies that everyone’s risk tolerance should increase. If the opportunity cost of doing things is lower, the optimal amount of risk to take is higher. For example, if it used to cost you 5% a year to borrow money for your business, and now it costs you 1%, you should borrow more and start more businesses.
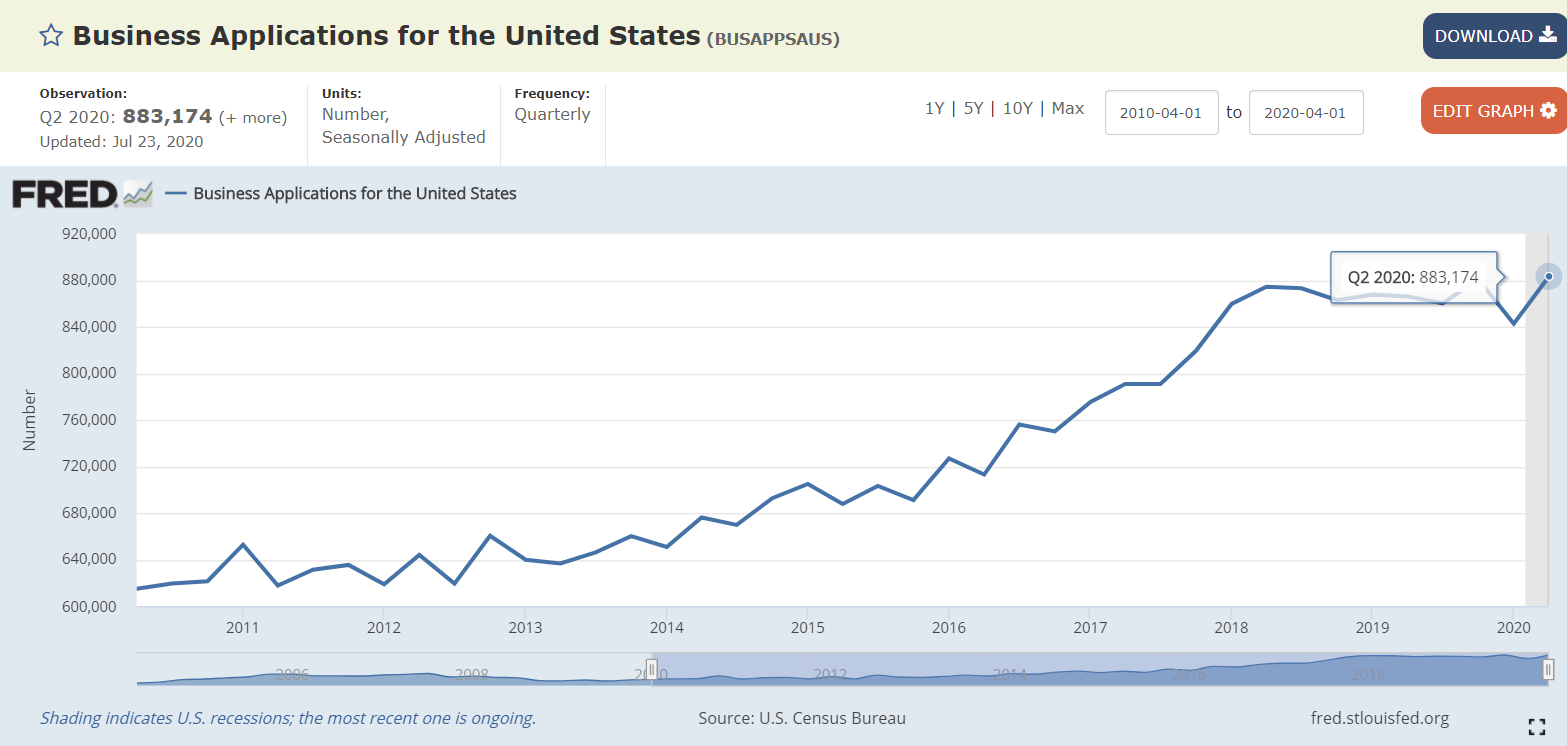
The actual data is more noisy. The Fed data on business applications seems to validate my assumption [7], but I’ve also read that the quality of businesses has declined. Based on the inflation of valuations for private companies trying to raise money, I still believe that more people are taking risk at lower cost, but let me know if you disagree.
Increased risk tolerance also implies more speculation on investable assets. I believe that’s a reason why we’ve continued to see the price of public equities rise, as people search for return and push the stock market further up.
Since all assets are linked, this trend isn’t limited to public equity either. All asset classes should see prices rise, and returns fall, as costs come down. We should see more angel funds, venture investment, or private equity buyouts. Current news seems to confirm this.
This sounds great, after all everyone likes things to go up. I can think of at least two caveats, and am still trying to come up with more.
The first is that increased risk tolerance comes with the tradeoff of more fraud. If everyone can raise money, the chance of cons should rise. When people see that there’s low downside to something and high upside, the optimal choice is to do more of it. There will be more people trying to take advantage of this situation and deceive others. I believe that’s why we see more fraudy businesses like Luckin Coffee, Nikola, or whatever the hell Kodak’s doing this month.
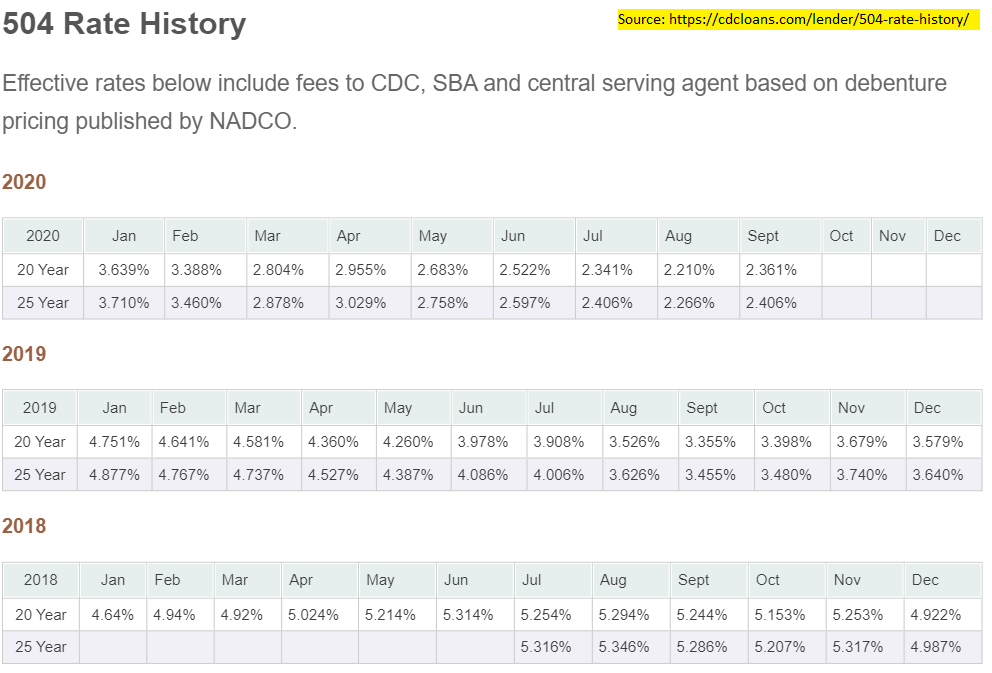
The second is that I’ve heard the lowered cost of capital is unevenly spread across sectors. Supposedly, small business loans are still expensive. I’m no expert here, and the initial data I looked at here seems to show otherwise, but I can see this as a plausible phenomenon. For example, I’ve always been annoyed that personal loan rates are still positive, compared to overall negative rates on average [8].
The overall takeaway then, is that every individual now should increase their risk tolerance and take part in more risky activities, as their base cost has gone down. Whether that means more investment into public equities, alternative asset classes, or your friend’s new business, is up to you to decide. As always, this is not investment advice, and I’m interested in seeing counterarguments to the above.
Footnotes
- There are many variations of debt, equity, and hybrid securities like convertibles (part debt, part equity). For ease of discussion let’s stick to just the two
- I’m not going into yields vs interest rates to keep things simple, read here for a start to learn more.
- Whether they get that return is a different matter. Remember we’re just dealing with expectations here, not actual returns. To make the example more concrete, imagine if the investor had a higher cost of equity return hurdle, say 100%. If they still wanted to invest in you, they would either have to demand a lower valuation, so that they can get a higher exit vs entry multiple. Or they demand more ownership for the same amount of cash.
- Board of Governors of the Federal Reserve System (US), 10-Year Treasury Inflation-Indexed Security, Constant Maturity [DFII10], retrieved from FRED, Federal Reserve Bank of St. Louis; https://fred.stlouisfed.org/series/DFII10, September 14, 2020.
- Freddie Mac, 30-Year Fixed Rate Mortgage Average in the United States [MORTGAGE30US], retrieved from FRED, Federal Reserve Bank of St. Louis; https://fred.stlouisfed.org/series/MORTGAGE30US, September 14, 2020.
- More precisely, the risk free rate plus beta times the equity risk premium
- U.S. Census Bureau, Business Applications for the United States [BUSAPPSAUS], retrieved from FRED, Federal Reserve Bank of St. Louis; https://fred.stlouisfed.org/series/BUSAPPSAUS, September 14, 2020.
- I get why this is the case, you have to adjust for risk of the individual blah blah. I’m still annoyed as I want free money.
If you liked this, sign up for my finance and tech newsletter: